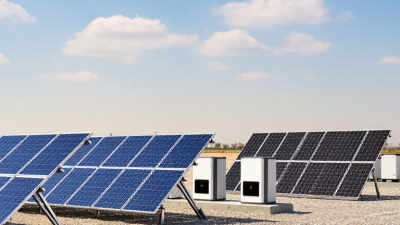
Why Choose Smart Solar for Your Business?
Why Choose Smart Solar for Your Business? The answer starts with a closer look at how your business uses electricity. Smart Solar can combine rooftop solar panels, battery storage, and monitoring software to align energy supply with real operating needs. Picture a warehouse tracking refrigeration loads through the afternoon, then using stored power when grid prices rise. The technology is promising, but savings are not automatic.
The scale is significant. IRENA’s Renewable Capacity Statistics 2024 reports that solar added about 346 gigawatts of global capacity in 2023, roughly 73% of all renewable capacity additions that year. This signals rapid adoption, not a guaranteed return for every company. As IEA Executive Director Fatih Birol put it, “Solar is the new king of electricity markets around the world.” A business still needs to test that broad trend against its own tariff, roof condition, demand profile, and financing costs.
Start with your bills. Then compare them with interval meter data and a site assessment from a qualified solar professional. Ask how the system handles cloudy days, peak demand, maintenance, and battery replacement. A dashboard may reveal wasted energy, but it cannot fix every operational habit. That is worth remembering.
Smart Solar is most compelling when it supports a clear business goal: more predictable energy costs, improved resilience, or measurable emissions reductions. The right design depends on the site, and sometimes the numbers simply do not work. Better to find that out before installation.
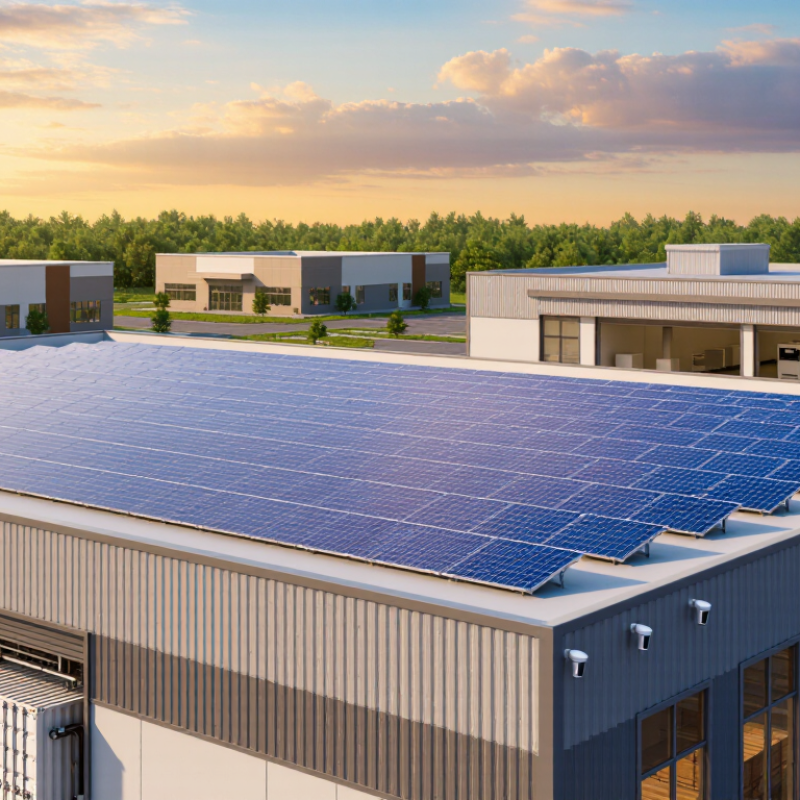
How Businesses Define Smart Solar and Assess Their Energy Demand
Businesses define smart solar differently. For one site, it may mean rooftop panels paired with battery storage and live energy monitoring. For another, it may include controls that shift flexible equipment use toward sunny hours. The useful definition depends on the work being done. A cold-storage warehouse, for example, has steady refrigeration loads, while an office may peak during afternoon cooling. Look beyond panel output. Smart design connects generation, storage, and operating schedules to actual demand. Real data helps.
Assessment starts with utility bills and interval meter records, ideally covering a full year. Note peak demand, seasonal changes, and unusual shifts, such as extra production on summer evenings. Walk the site, too. A meter can show when usage rises, but staff may explain why a compressor starts at 6 a.m. Compare weekday and weekend patterns, then identify loads that can safely move without disrupting operations. That part can be imperfect; estimates often miss small equipment or future growth. Record assumptions, check them with facility staff, and revisit them before sizing a system. A credible assessment should show expected energy use, peak loads, available roof or ground area, and the limits of backup power.
IRENA Reports 345.5 GW of Solar Capacity Added Worldwide in 2023
IRENA reports that the world added 345.5 GW of solar capacity in 2023, making solar the largest contributor to renewable power growth that year. The agency’s Renewable Capacity Statistics 2024 puts total global solar capacity at about 1,419 GW. That expansion is visible in practical terms: more panels on factory roofs, warehouse canopies, and open land near demand centers. The numbers are impressive. But they do not mean every site is a good investment.
For a business, smart solar planning starts with its actual electricity use. Compare hourly consumption with expected solar production, then assess roof condition, shading, connection limits, and local tariffs. The International Energy Agency has also highlighted the importance of grids and flexibility as renewable generation grows; solar output rises and falls with daylight. Storage can help shift some energy, but it adds cost and requires careful sizing. A clear business case should show assumptions, installation costs, maintenance, and likely savings—not just annual generation. Projections can miss. That deserves scrutiny. Done well, solar can reduce exposure to purchased electricity and support long-term energy planning, while leaving room to revise the design when operating needs change.
Compare Rooftop PV, Solar Carports, and Off-Site Power Contracts
Choosing business solar begins with the shape of your energy use, roof, and budget. Rooftop PV uses existing space and can reduce daytime grid purchases. A site survey should check shading, roof age, structural capacity, and maintenance access. Replacing a roof soon can change the economics. Easy to overlook.
Solar carports add covered parking while generating electricity above vehicles. They can suit sites with limited roof area, but foundations, drainage, lighting, and traffic flow need careful review. Employees may value shade on hot afternoons. Construction can disrupt parking, sometimes more than planners expect. That matters.
Off-site power contracts can serve businesses with little usable land or several locations. The buyer agrees to purchase energy under defined terms, while generation happens elsewhere. Compare contract duration, price adjustments, delivery arrangements, and how supply matches hourly demand. Such agreements do not necessarily mean a facility receives power from a dedicated array every moment. Read the details. A useful comparison models all three options against actual utility bills and operating schedules. Include maintenance, roof work, parking changes, and contract risks. Data is rarely perfect, and forecasts can be wrong. Start with measured consumption, then test conservative assumptions before committing.
Why Choose Smart Solar for Your Business? — Compare Rooftop PV, Solar Carports, and Off-Site Power Contracts
| Comparison factor | Rooftop PV | Solar carports | Off-site power contracts |
|---|---|---|---|
| How it works | Panels are installed on suitable building roofs and connected to the site electrical system. | Panels are mounted on canopies over parking areas and connected to the site electrical system. | A business contracts for electricity from a separate renewable energy project. Delivery may be physical or financial, depending on the contract and market. |
| Best suited to | Sites with structurally suitable roofs, adequate unshaded area, and daytime electricity use. | Sites with sizable parking areas, suitable electrical infrastructure, and value in providing covered parking. | Businesses seeking renewable electricity volumes beyond what their own sites can produce, or without space for on-site generation. |
| Space requirement | Uses roof area that is available after allowing for access routes, equipment, setbacks, and shading. A preliminary module-area estimate is roughly 5–8 m² per kW of PV capacity; actual roof area needs can be higher. | Uses parking-lot footprint rather than roof space. A preliminary estimate is roughly 6–10 m² of canopy footprint per kW, depending on design, spacing, and site layout. | No on-site generation area is required. The contracted project uses land or other project space elsewhere. |
| Typical generation | As a broad planning range, many locations produce about 1,000–1,700 kWh per kW of installed PV capacity per year. Actual output depends on solar resource, orientation, shading, system design, and losses. | Contracted energy is specified in the agreement. The quantity and delivery profile depend on the project, contract structure, and market; it is not directly comparable with an on-site system’s installed capacity. | |
| Up-front investment | Usually requires investment in panels, inverters, electrical work, engineering, and any necessary roof or structural upgrades. Costs vary substantially by market and site. | Usually requires investment in panels, canopies, foundations, electrical work, and drainage or lighting integration. Structural and civil works can make the project more complex than rooftop PV. | May avoid construction investment at the business site, but can involve credit requirements, contract administration, and exposure to agreed pricing or market terms. |
| Typical development timeline | Often several months from assessment to commissioning; roof condition, permitting, interconnection, and project size affect timing. | Often several months or longer. Structural design, foundations, parking-lot works, permitting, and interconnection can extend delivery. | Contract negotiation and project or market arrangements may take months. Timing depends on procurement, approvals, and whether the project is already operating or still under development. |
| Potential site benefits | Can reduce electricity purchased from the grid while making productive use of existing roof space. | Can generate on-site electricity and provide shade and weather protection for parked vehicles; lighting or electric-vehicle charging may be integrated where designed. | Can support renewable electricity procurement at a scale not limited by a company’s own roof or parking area. |
| Key constraints | Roof age, structural capacity, shading, fire-access requirements, and grid-connection limits may restrict the project. | Higher civil and structural complexity, construction disruption to parking, drainage, and available land can affect feasibility. | Contract duration, pricing and settlement terms, counterparty credit, market rules, and the distinction between electricity delivery and renewable attributes require careful review. |
| Resilience and power supply | Standard grid-connected PV generally shuts down during a grid outage for safety. Backup power requires appropriately designed storage and islanding equipment. | Standard grid-connected PV generally shuts down during a grid outage for safety. Backup power requires appropriately designed storage and islanding equipment. | Does not, by itself, provide backup electricity to the business during a local grid outage. |
| Contract or asset life | Panels commonly carry performance warranties of around 25–30 years; inverters and other components may have shorter service lives. | PV components have similar warranty considerations to rooftop systems; the canopy structure also needs long-term inspection and maintenance. | Contract terms vary; long-term power purchase agreements commonly run for 10–20 years, though shorter or longer arrangements exist. |
| A practical first step | Review electricity bills, roof condition, structural capacity, shading, and interconnection options. | Assess parking demand, site layout, foundations, drainage, utility connections, and construction phasing. | Define the electricity volume and risk profile to procure, then review delivery, pricing, settlement, and renewable-attribute provisions. |
Note: Figures are indicative planning ranges, not project guarantees. Output, costs, timelines, and contract terms vary by location, design, regulations, and market conditions. A site-specific technical and commercial assessment is needed before making investment decisions.
Use Site-Specific Tariffs to Estimate Costs, Savings, and Payback
Why Choose Smart Solar for Your Business?
Use Site-Specific Tariffs to Estimate Costs, Savings, and Payback
A useful solar estimate starts with your actual electricity bill, not a regional average. Tariffs can vary by time of use, demand charges, export rates, and fixed fees. A warehouse running refrigeration overnight may save differently from a daytime office. Match the site’s hourly consumption with local tariff rules and a realistic solar production estimate. Small details matter.
Compare expected bill reductions with the full project cost, including installation, electrical upgrades, maintenance, and battery storage if needed. Model several cases: sunny and cloudy production, changing usage, and different export-credit assumptions. The result is a range, not a promise. Payback depends on tariff changes and how much solar power the business uses while it is being generated. Estimates can look neat on paper. Actual operations are messier, and that deserves attention.
Tips: Gather 12 months of bills and interval data, if available. Confirm the current tariff with the utility or a qualified energy adviser. Ask for the assumptions behind each savings figure, including maintenance and panel degradation. Check whether roof shading, operating hours, or planned expansion could change the forecast. Revisit the estimate before signing; one overlooked demand fee can shift the payback period.
Why Choose Smart Solar for Your Business?
Estimated cumulative savings and payback using an illustrative commercial site scenario.
Scenario assumptions: an 80 kW system generating 112,000 kWh annually, a retail electricity tariff of $0.18/kWh, a $0.05/kWh export credit, 70% on-site solar use, and an estimated installed cost of $120,000. Annual savings are assumed to rise by 2%; estimated payback occurs during year 8. Actual results depend on your site, tariff, usage, and system costs. Incentives, financing, taxes, demand charges, and maintenance are excluded.
Plan Storage and Grid Integration as Solar Supplies 5.5% of Global Electricity
Solar now supplies about 5.5% of global electricity, making it a meaningful part of the energy mix. For businesses, that figure signals a changing operating environment. Rooftop panels can reduce daytime grid purchases, but production rarely matches demand hour by hour. A warehouse may export power at noon, then draw heavily when evening shifts begin. That mismatch matters. A storage plan should start with interval meter data, not a battery quote. Review load peaks, tariffs, outage priorities, and seasonal solar output across at least a year. Then size storage for a specific purpose: shifting energy, supporting critical circuits, or reducing peak demand. No battery does everything well.
Grid integration deserves equal attention. Check inverter capacity, export limits, protection settings, and utility interconnection timelines before construction. Coordinate controls so the system knows when to charge, discharge, curtail, or preserve backup reserve. A commissioning test during both cloudy weather and a high-load period can reveal control gaps. Keep the design flexible; tariffs, production schedules, and grid requirements can change. Forecasts are imperfect. A modest first phase, paired with clear performance tracking, may teach more than an oversized system. Track self-consumption, peak demand, battery cycling, and downtime each month.
Related Posts
-
What Is the Latest Solar Power Technology?
-
How to Choose Smart Solar Systems for Your Business?
-

Navigating Import and Export Certifications for New Solar Power Technology Success
-
2025 Solar Technology Innovations: Essential Considerations for Global Buyers
-
Understanding the Benefits of Power Smart Solar for Global Buyers
-

Advancements in Solar Technology Setting New Industry Production Standards